
Revenue
€84,200+8,4%Financial dashboard for entrepreneurs
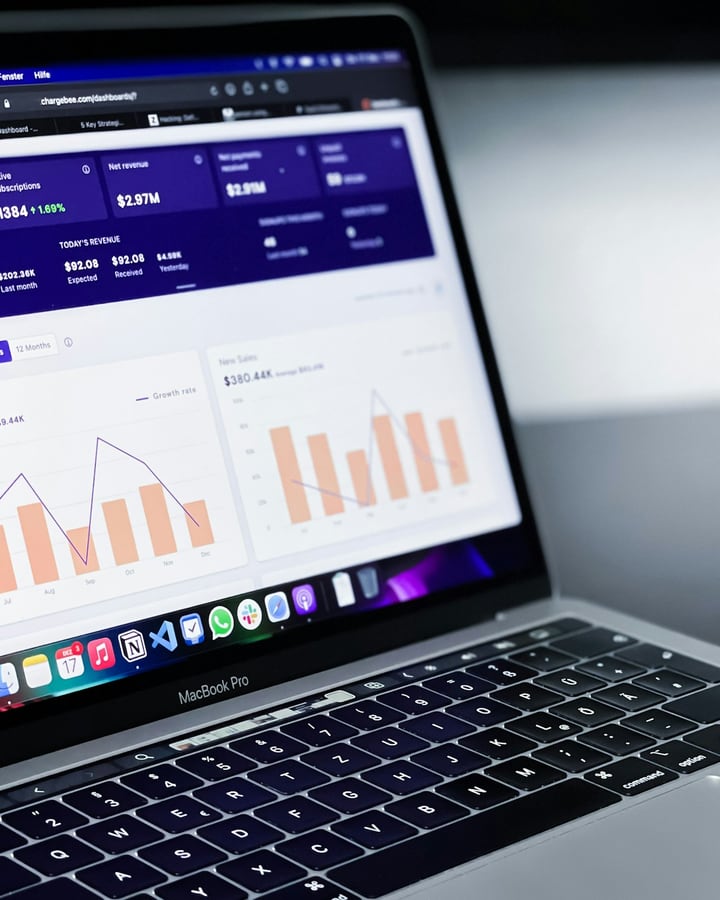
Financial dashboard for entrepreneurs with current KPIs
A financial dashboard for entrepreneurs brings financial and operational information together for growing businesses and online stores. Revenue, margin, costs and cash flow are translated into KPIs aligned with your information needs and decisions about pricing, costs, inventory, investment or growth.
Freshness is determined for each data source and technical route. A dashboard is therefore only as current as the latest successful source update and the underlying accounting records. We document the expected refresh cadence and required controls in advance.
Interactive example
See how a financial dashboard can work
Switch between month, quarter and year. The KPI cards, revenue chart, forecast and top clients update immediately. All amounts and client names in this example are fictional.
Gross margin
€31,700+3,1%Cash position
€52,400+5,7%Outstanding
€18,600−4,2%Revenue and forecast
Top clients
Based on fictional revenue
- 1Client A€18,600
- 2Client B€14,200
- 3Client C€11,900
The deliverable
What do you get with a financial dashboard?
Building a financial dashboard starts with information needs, sources and definitions. The final scope depends on the available data and selected technical route.
- Inventory of the decisions, reporting needs and users involved
- Overview of available data sources, ownership and possible refresh cadence
- Definition of relevant KPIs, calculation rules and comparisons
- Setup of a coherent dashboard and data structure
- Connection or import of sources within the agreed technical scope
- Design and build of views, filters, periods and comparisons
- Reconciliation of dashboard totals with available source data
- Documentation of exceptions, access, explanation and handover
- Separate agreements on licences, periodic updates, monitoring, maintenance and analysis
KPIs by information need
Which KPIs can be included in a financial dashboard?
The goal is not to include as many charts as possible. We first determine which KPIs align with your business goals and the decisions the dashboard should support.
General financial
Examples that may support decisions about costs, financing, investments and performance.
- Revenue and gross margin
- Profit and cost development
- Outstanding receivables and payables
- Liquidity and cash flow
E-commerce
Relevant when the required sales, fee and cost data is available and can be compared consistently.
- Revenue and margin by channel
- Returns and refunds
- Platform and payment-provider fees
- Advertising costs and average order value
- Performance by product group
Operational
Operational KPIs are only added when they demonstrably contribute to the financial information need.
- Volumes and lead times
- Deviations and exceptions
- Performance by team, location or channel
Freshness and refresh cadence
How current is a KPI dashboard?
“Current” is not one fixed technical frequency. Accounting records, sales channels, payment data and supplied files may become available at different times.
Source cadence
Each data source has its own update or delivery rhythm. Information within one dashboard can therefore differ in freshness.
Updated accounting records
Financial management information is only as current as the underlying bookkeeping, reconciliations and corrections.
Integration or import
An available integration may follow a different cadence from a manual export or import. We document the chosen route and expected frequency in advance.
Exceptions
Delays, missing records or an unavailable source must remain visible and may require additional review.
Scope and software
Implementation, platform and management are separate choices
Flicc Finance can provide a combination of advice, configuration of existing integrations or imports, third-party dashboard software and, where appropriate and technically feasible, a custom API integration.
Implementation
Analysis, KPI definitions, dashboard structure, connection or import, build, review and handover within the agreed engagement.
Software and licences
There is no single dashboard platform for every situation. The choice depends on sources, reporting, access, export and management. Required accounts and licences are discussed in advance.
Management and changes
Updates, monitoring, maintenance and changes after delivery are only included when separate arrangements have been agreed.
Analysis and advice
A dashboard visualises the figures. Periodic interpretation, review and decision support fall under controlling and financial advisory.
Approach
From information need to financial reporting
The route is determined by the decisions, source quality and technical options, not by a preselected chart or software package.
Define the information need
We discuss which decisions the dashboard should support and which users need the information.
Document sources and definitions
We map available data, refresh cadence, KPI calculation rules, exceptions and responsibilities.
Configure the dashboard
We configure a suitable route through an existing integration or import, or investigate custom development when the available technology requires it.
Review and hand over
We compare relevant totals with the source, test filters and exceptions and document use and management.
Data quality and control
A dashboard remains dependent on reliable source data
Visualisation does not resolve source problems automatically. Definitions, reconciliations, exceptions and responsibilities therefore form part of the setup.
Reconciliation with source data
Relevant dashboard totals are compared with the available accounting records or other agreed source during implementation.
Missing and duplicate records
We determine which controls are needed to make incomplete, duplicate or unusual records visible.
Corrections, refunds and fees
Processing depends on the available source fields and documented calculation rules. Deviations remain part of the review.
Access and outages
We agree who remains the owner of accounts and source data, what access is required and who follows up when a source is not updated.
General example
An e-commerce dashboard for periodic management
The example below shows how a possible dashboard engagement can be defined. It is not a client case and includes no performance claim.
Information need
An e-commerce entrepreneur wants to discuss revenue, margin, fees, returns and cash flow in one recurring management view.
Data sources
The accounting records, sales data, payment information and an optional supplied advertising file are separate sources.
Refresh and review
For each source, the team documents when data becomes available and which totals and exceptions require review.
Use
The dashboard supports periodic discussion of developments and deviations; substantive interpretation remains a separate step.
The actual KPIs, sources, frequencies and controls are determined for each business.
How the services connect
Dashboarding, bookkeeping, automation and controlling
Dashboarding brings figures together and visualises developments. It is one part of the financial information chain.
Frequently asked questions
Frequently asked questions about financial dashboards
What is a financial dashboard for entrepreneurs?
A financial dashboard for entrepreneurs brings selected financial and operational data together in one visual overview. KPIs, filters and comparisons are aligned with the decisions you want to support. The figures remain dependent on the quality and freshness of the sources used.
How current are the figures in the dashboard?
This differs by data source and chosen setup. An integration, periodic export or updated accounting system can each follow a different cadence. We document how often data becomes available, when an update is considered successful and which delays or exceptions require review.
Which KPIs belong in a financial dashboard?
There is no universal KPI list. Revenue, gross margin, profit, cost development, outstanding items, liquidity and cash flow may be relevant. For e-commerce, channel margin, returns and fees may be added when the required data is available. Business goals and decisions determine the selection.
Which dashboard software do you use?
Flicc Finance does not use one fixed platform for every situation. The choice depends on available data sources, reporting needs, access, export options, account ownership, licences and management. We discuss in advance whether an existing integration, import, third-party dashboard tool or custom route is appropriate.
What is the difference between a dashboard and a management report?
A dashboard visualises selected KPIs and developments. A management report usually places figures within a fixed period and context, sometimes with commentary. Analysis and financial steering go one step further by discussing causes, scenarios and possible actions.
Who owns the data and dashboard accounts?
Ownership and access are agreed before implementation. The aim is to keep it clear who owns and administers source data, accounts and any licences. The exact setup depends on the selected platform and third-party systems.
What happens when a data source or integration is unavailable?
Available alerts differ by source and technical route. We document how a missing update can be recognised, which data can be processed again and who is responsible for follow-up. Ongoing monitoring is only included when agreed separately.
Is maintenance included after delivery?
Not automatically. One-off implementation, software licences, recurring management and financial advice are separate components. We document the scope in advance and make separate arrangements for updates, monitoring, maintenance or periodic analysis.
Discuss your dashboard
Discuss which financial dashboard fits your business
We review your information needs, available data sources and the decisions the dashboard should support. This provides the basis for defining an appropriate scope.